Unravelling the Mysteries of Bounce Rates, Time on Site & Conversions
Bounce rates seem relatively simple to understand, but more subtle questions can lurk beneath the surface. We dig into some of the issues involved
Bounce Rates
Firstly, what is a bounce?
Very simply, someone visits a URL on your site (say from a search engine), does not visit any other URL, and then leaves to go to another site (e.g. back to the same search engine).
Secondly then, what’s the bounce rate? This is the percentage of all visits that bounced – in other words, if 50% of all your visits went elsewhere after looking at one URL, the bounce rate is 50%.
Google define this more rigorously as:
ga:entranceBounceRate

The percentage of single-page visits (i.e. visits in which the person left your site from the entrance page).

Calculation: (ga:bounces / ga:entrances) * 100
(see https://developers.google.com/analytics/devguides/reporting/core/dimsmets/session#ga:entranceBounceRate for more information from Google)
Another useful resource regarding bounce rates is this very useful Google video on bounce rate, which features the immortal line: “I came, I puked, I left”:

How Can Google Analytics Help?
We all want significant free traffic from Google (“natural search” or “organic search” traffic), but there’s not much point in winning such traffic if it doesn’t stay on the site, i.e. if it immediately just bounces away ….. Google Analytics can help us identify whether this is indeed happening. Here’s how:
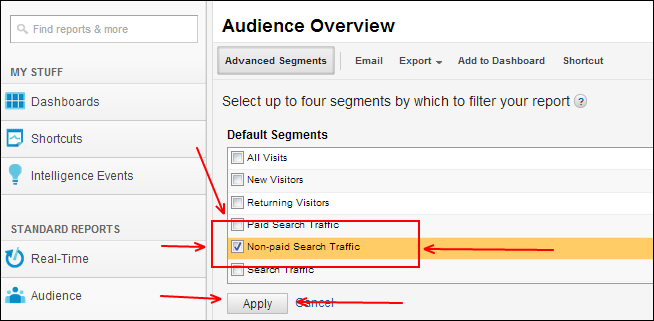
Firstly, in Google Analytics, select the “Non-paid Search Traffic” segment. With this selected, *any* report you now look at in Google Analytics will be for just “natural search” (or “organic search”, or “Non-paid Search”).
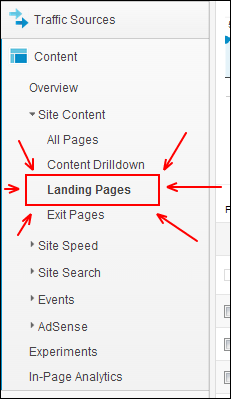
Secondly, we want to look at “Landing Pages” – i.e. the pages that people first land on when they visit the site. Given that we’ve just selected the “Non-paid Search Traffic” segment, this means that we’ll be looking at just those pages that visitors first land on from natural search.
Now, lets take a look at bounce rates … on the right of the screen you should now see “Bounce Rate”, just next to “% New Visits”. Excellent, this shows us the bounce rate per URL.
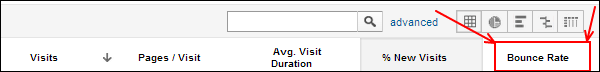
Just to add another piece of data to the equation, just along to the left you should also see “Avg. Visit Duration” – i.e. the average time a visitor took on a page. All useful information.
But What Does it All Mean?
Consider a few scenarios:
- A URL has a high bounce rate, and a very low average visit duration. This probably isn’t great as it means a high percentage of visitors both left your page and site after looking at just one page *and* left very quickly. This implies that both the page content and page navigation aren’t giving them what they want. But …. as we discuss below, it could mean other things …
- A URL has a high bounce rate and a very long average visit duration. So, lots of visitors left your page and site after looking at one page, but after spending along time on the page. Were they all just indecisive? Unlikely. This is more subtle, and enters the territory of “depends”. Perhaps your products are complex and require significant thought; perhaps the page has considerable copy that simply takes time to read; perhaps your product is competing well with others forcing indecision, but not quite forcing the sale. Perhaps yet more options.
The last example highlights how the data is clearly highly valuable, but also that the interpretation isn’t always obvious.
In fact, Bloom Reach, a Californian start-up founded by ex-Googlers, recently came out with some research indicating that rising bounce rates can in some circumstances be due to shoppers knowing exactly what they want, and having little tolerate of not exactly finding it – as opposed to a major issue with the user experience on your site.

Digging a Little Deeper
To get a bit more clarity, the first thing to do is to split natural search landing pages into three groups:
- Hard bounce: Bounce rate over 75%, and an average time on site of less than four seconds.
- Soft bounce: Bounce rate over 75%, and an average time on site of greater than thirty seconds.
- Moderate bounce: Bounce rate over 75%, and an average time on site between four and thirty seconds.
So, download all landing page URLs, and categorise them in Excel into the above three groups. This allows you to see a little more clearly which of the above is happening more frequently than others, and to start analysing *why* particular behaviours are taking place.
Working Out What’s Going On
The first place to look is at the keywords people are using to arrive at a landing page and bouncing. Are they using words and phrases that are not particularly prominent visually? Are the keywords they’re using in the Title (and therefore possibly in the search result) but nowhere on the page?
If there aren’t any obvious places to look, the next thing to consider is using a commercial “HeatMap” tool such as Crazy Egg that allows you to see where people are clicking on your site and how they’re interacting with it.
Then, once you have some theories, the next step to consider is some “A/B” testing using tools such as Optimizely.
These last few stages can take a while, and essentially involve very careful experimentation, but the benefits of making such changes, even from making tiny changes can be considerable.
What Now?
We strongly recommend that you regularly examine your bounce rates, and if needs be, we’d happily help where we can. Please don’t hesitate to get in touch with any questions.
